How to Make Charts in Excel using Node.js
Excel file manipulation and conversion to other formats programmatically give a competitive edge to business applications. You can add charts, fonts, and other graphics to XLS/XLSX files with just a few lines of code in any language. In this post we use the XLSX JS library to automate the process and show how to make charts in Excel using Node.js programmatically.
We will cover:
XLSX JS library installation
The XLSX JS library installs easily without third‑party dependencies. You can either download the API package or run the following commands:
npm install java
npm install aspose.cells
How to Make Charts in Excel using Node.js
After installing the API, follow these steps to create charts in Excel with Node.js:
- Create an instance of the Workbook class.
- Get the first worksheet using the get(index) method.
- Add sample values to cells with the putValue method.
- Call the add method to insert a chart into the worksheet.
- Retrieve the new chart using the get(index) method.
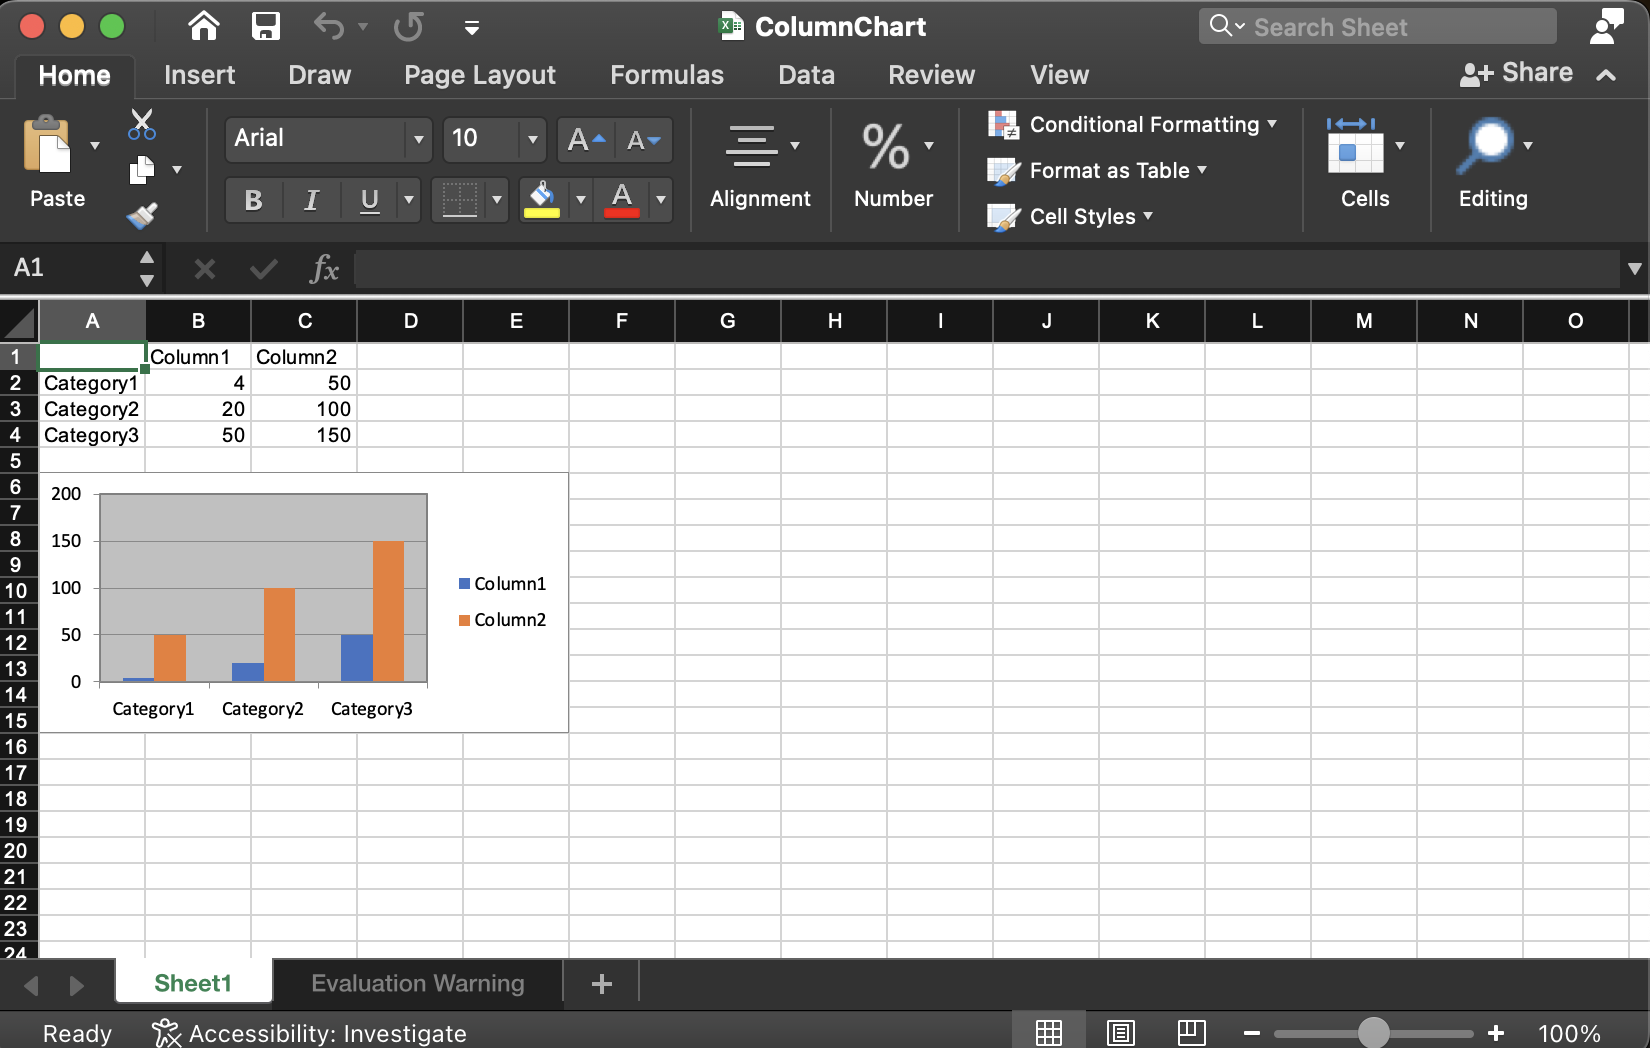
- Set the chart data source to range A1:C4 with the setChartDataRange method.
- Save the file in XLSX format using the save method.
Copy and paste the code below into your main file:
The resulting chart appears as shown:
Get a Free License
You can obtain a free temporary license to try the API without evaluation limits.
Summing up
We have demonstrated how to make charts in Excel using Node.js programmatically. For more details, explore the documentation of the XLSX JS library to discover additional features and methods. Stay tuned for future posts on creating pivot charts in Excel files. Visit conholdate.com for the latest updates.
Ask a question
Share your questions or queries on our forum.
FAQs
How do I create a Node.js Excel spreadsheet?
Install the XLSX JS library to create and process spreadsheets programmatically.
How do I make Excel charts automatically?
Follow the link to see the code snippet that creates charts in Excel files using Node.js.